Markt equilibrium
Equilibrium and changes to equilibrium
Market equilibrium: is where the supply equals to the demand.
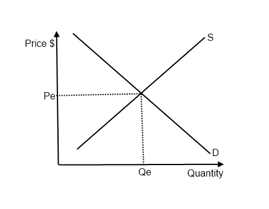
Figure 1.5 - Market equilibrium
Calculating and illustrating equilibrium using linear equations
The market is in equilibrium at Pe, when the amount of that product consumers wish to buy, Qe, is equal to the amount of coffee producer wish to sell.
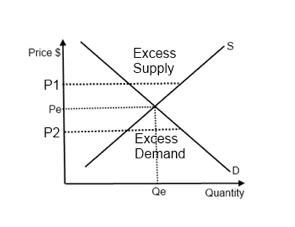
Figure 1.6 - Excess in supply and demand at different price levels
- Excess supply: More is being supplied than demanded at P1 → in order to eliminate the surplus, producer must lower the price
- Excess demand: More is being demanded than supplied at P2 → in order to eliminate this shortage, producer must raise the price
Changes in determinants cause changes in equilibrium
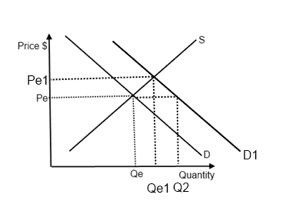
Figure 1.7 - A change in equlibiurm due to a change in determinants
- When there’s a change in determinants of demand/supply other than the price of the product, it would lead to a shift of a curve.
- When Demand shifts to D1, Qe is the quantity supplied, but Q2 is the quantity demanded, there is excess demand (of xxx units).
- Due to price mechanism (see below), the price will rise until Pe1, where the new equilibrium quantity, is both demanded and supplied.